본 post는 국가생명연구자원정보센터(KOBIC) 주관 서울대학교 박사 후 연구원 김준님의 Visualization를 정리한 내용입니다.
Intro
- Visualization에 가장 널리 쓰이는 circos plot에 대해 알아봅니다.
Circos Plot
Circos Plot은 chromosome, alignment, SNP/SV density를 plotting하는데 유용한 tool입니다.
Human chromosome 별로 색상을 구분하여 그린 ideogram입니다.
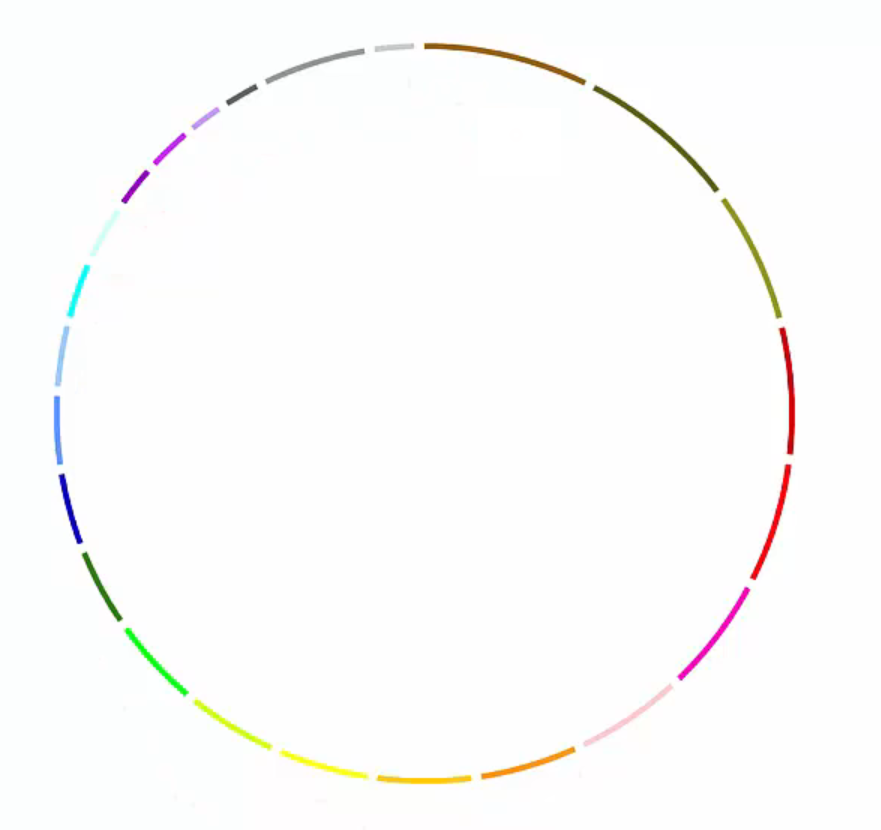 Human Ideogram
https://www.edwith.org/longread-seq-2023/lecture/1475115
Human chromosome 별로 gene density를 표현한 plot입니다.
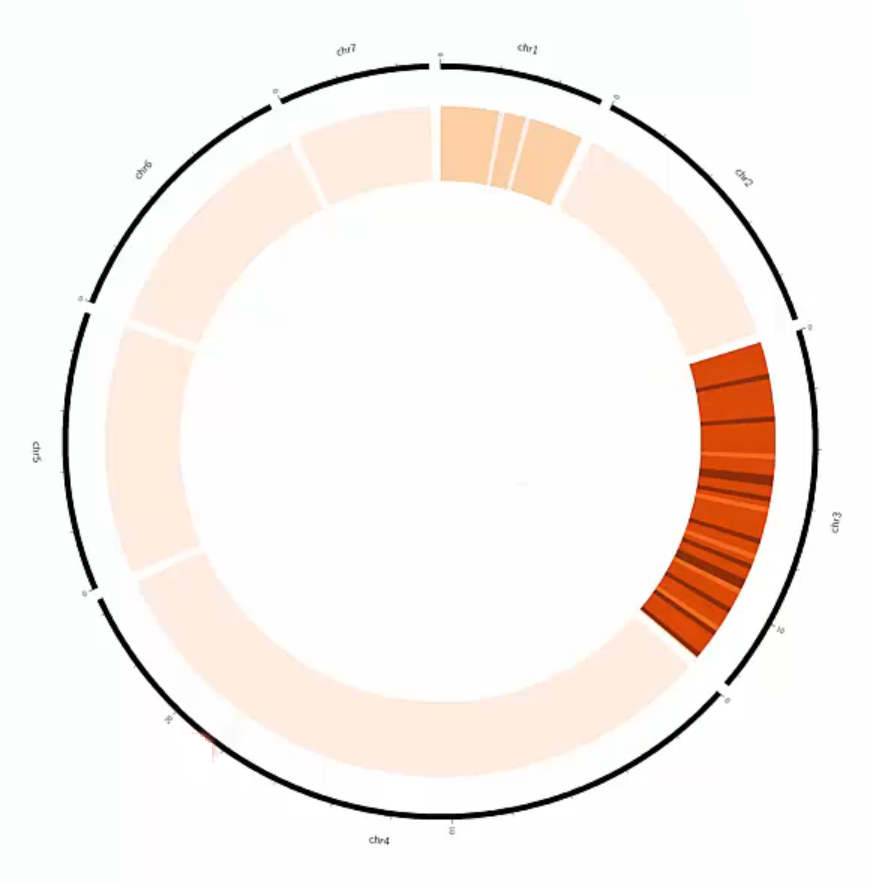 Gene Density
https://www.edwith.org/longread-seq-2023/lecture/1475115
위 plot에 alignment까지 추가한 plot입니다.
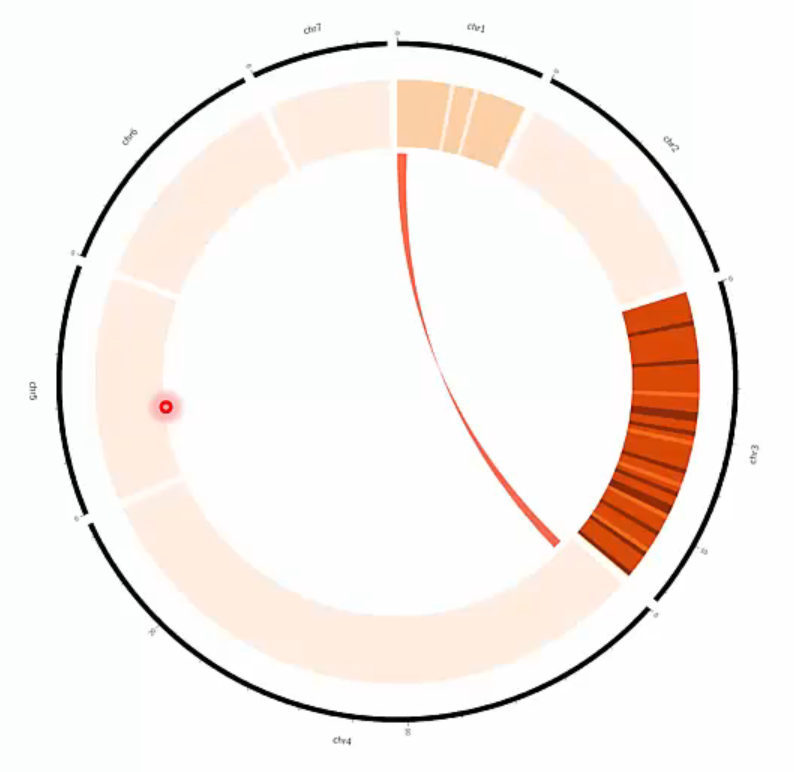 Gene Density with alignments
https://www.edwith.org/longread-seq-2023/lecture/1475115
Take Home Message
Circos를 이용하여 plot을 그릴 수 있습니다.
Gene density 외에도 SNP, SV, read depth 등을 포함할 수 있습니다.
Alignment를 이용해 다양한 관계를 표현할 수 있습니다.