본 post는 국가생명연구자원정보센터(KOBIC) 주관 아주대학교 의과대학 김규태 교수님의 단일세포 전사체 데이터 전분석 (실습)을 정리한 내용입니다.
Intro
Single cell data의 mapping, normalization, batch 제거 과정을 이해합니다.
Single Cell Data Mapping
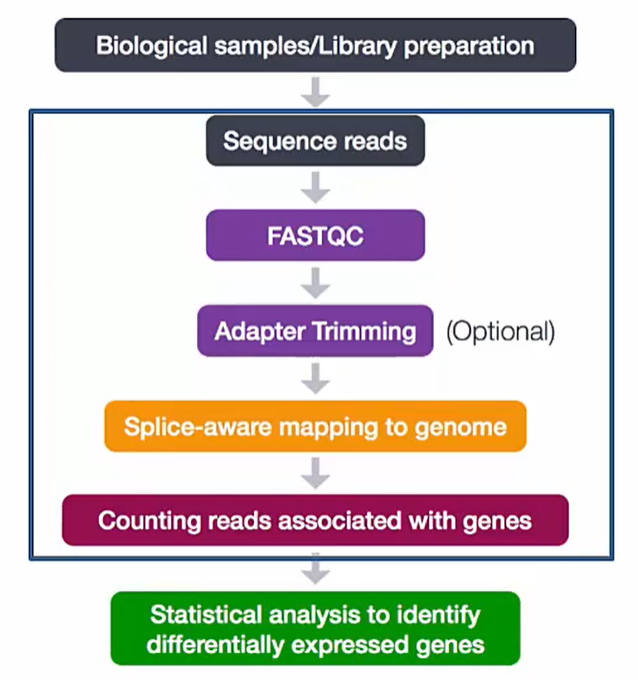 Basic Data Processing Workflow
https://www.edwith.org/single-cell/lecture/1417886
Sequencing data가 나오면 가장 먼저 QC check를 진행합니다. FastQC를 사용하여 read1,2 quality에 이상이 없는지 확인합니다.
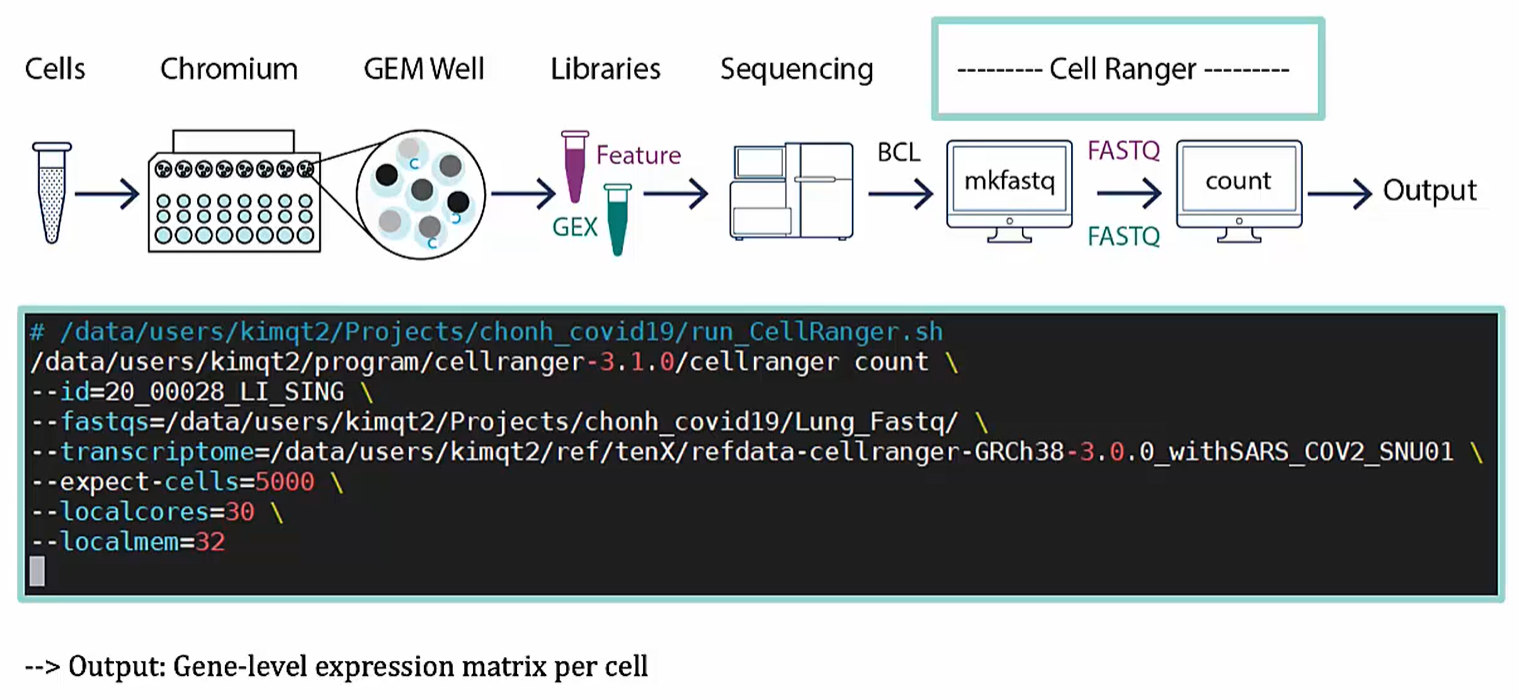 Pre-peocessing Pipeline of 10X CellRanger
https://www.edwith.org/single-cell/lecture/1417886
10x Genomics에서 제공하는 CellRanger로 분석을 진행합니다. Fastq를 input으로 받아서 분석한 뒤 gene level expression matrix data를 cell별로 제공합니다.
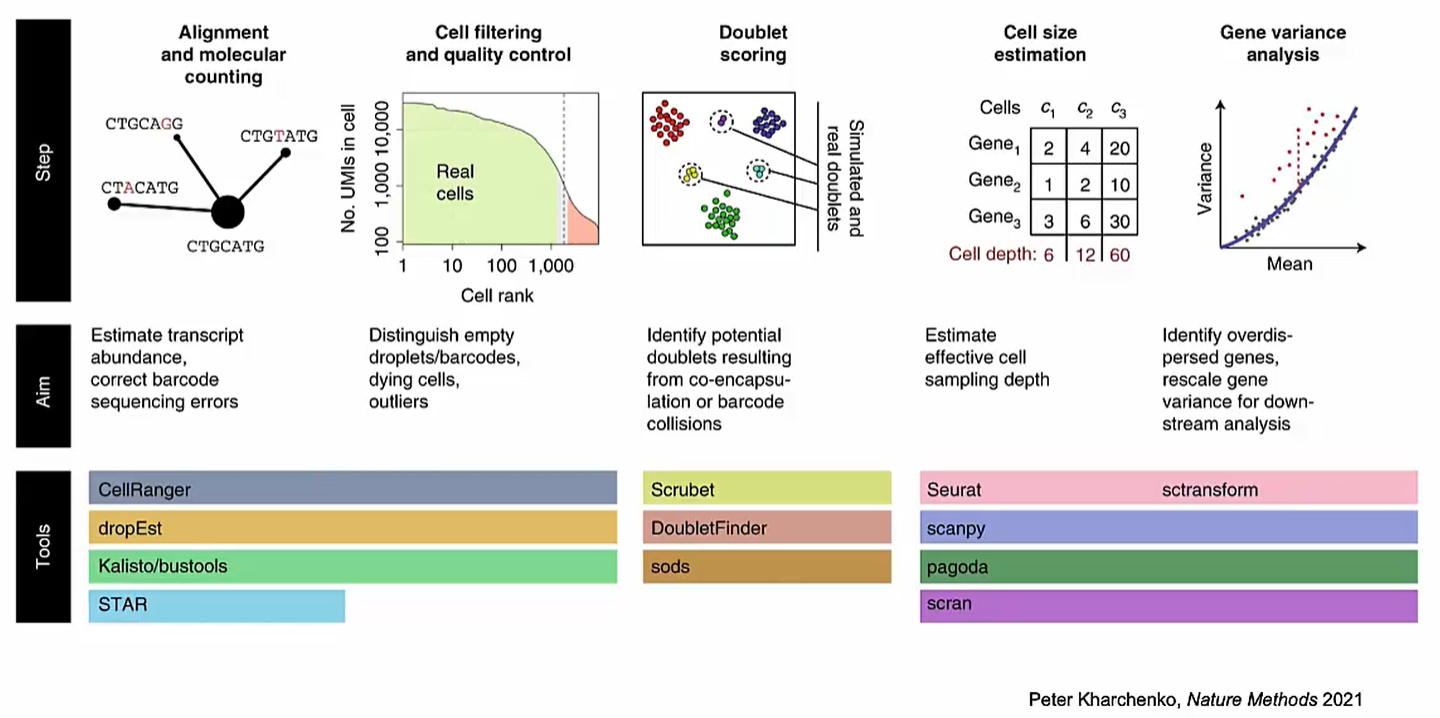 Data Processing and Normalization in scRNA-seq Data
https://www.edwith.org/single-cell/lecture/1417886
Data 전분석과 normalization 과정에 대한 설명입니다. CellRanger와 Seurat을 사용하여 진행할 수 있습니다.
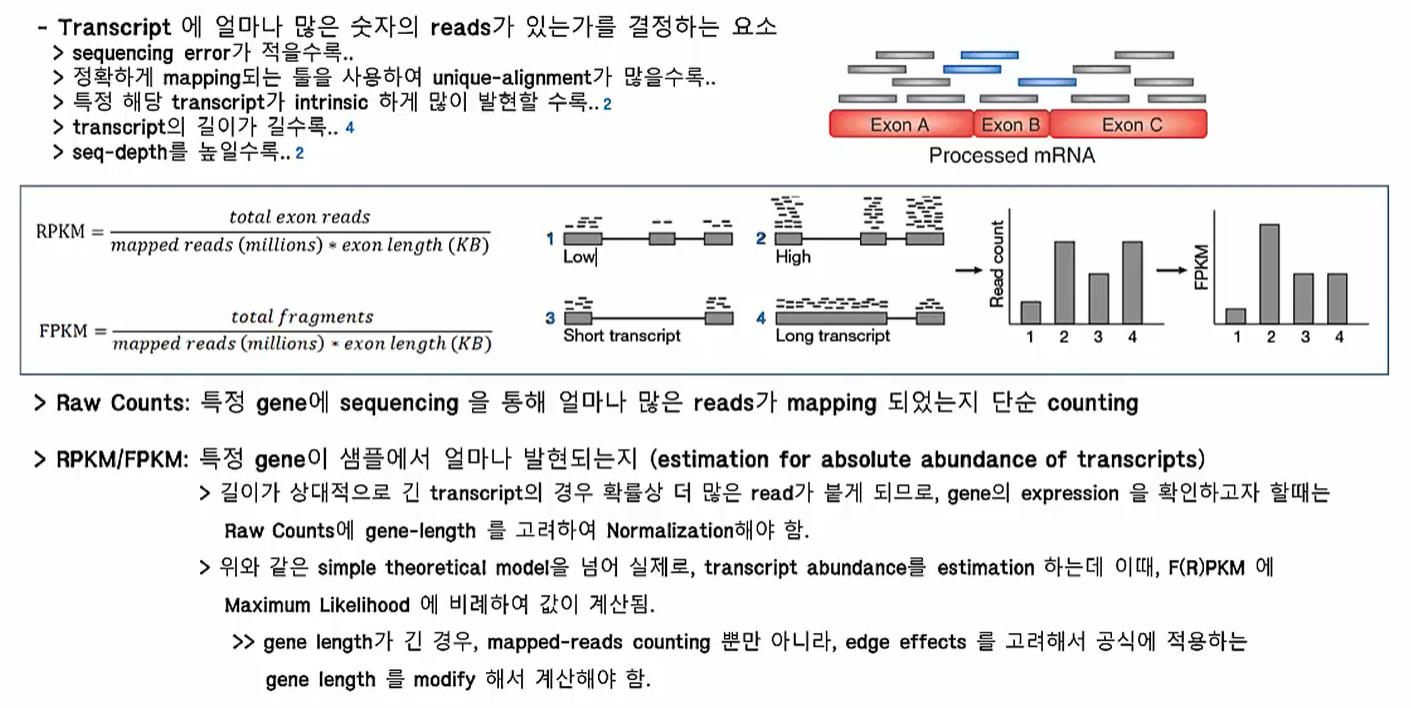 Estimation of Gene Abundances
https://www.edwith.org/single-cell/lecture/1417886
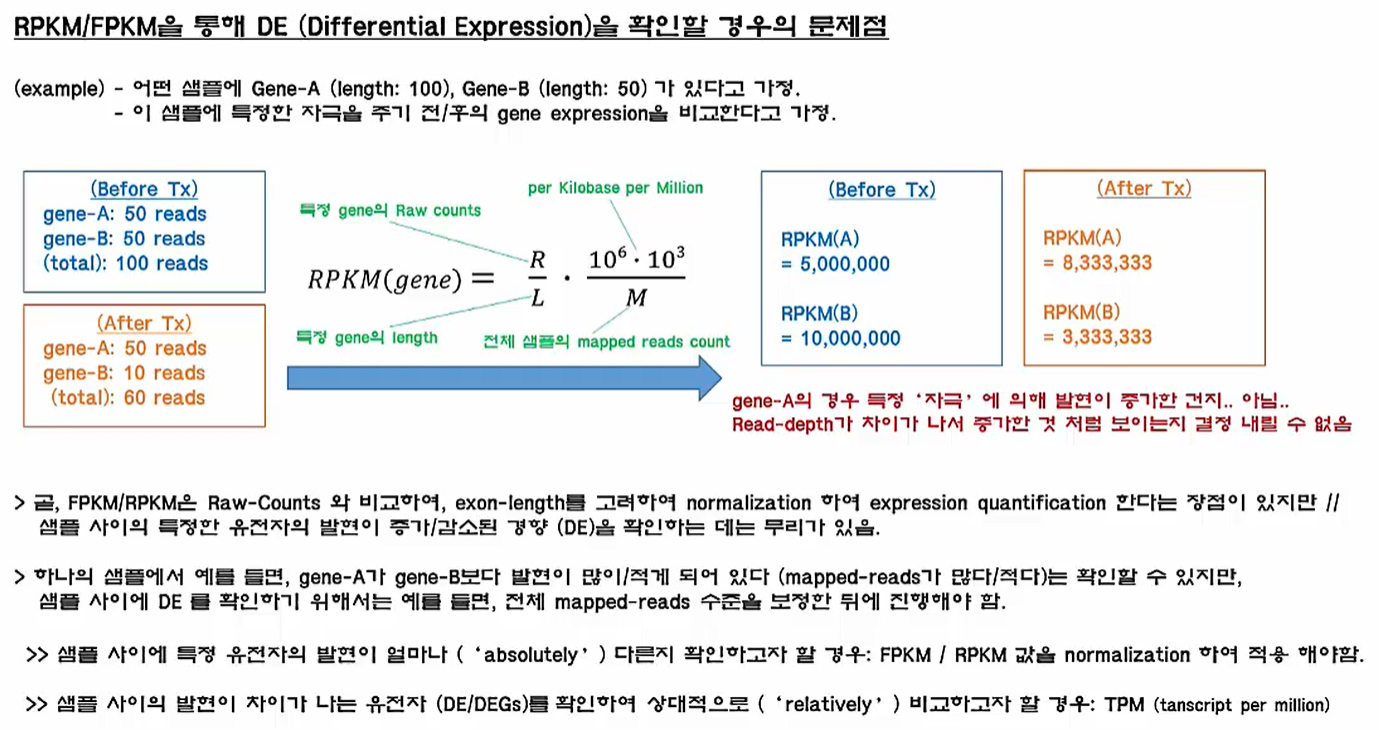
RNA sequencing data는 보통 RPKM/FPKM으로 read counts를 보정하여 특정 gene이 샘플에서 얼마나 발현되었는지 확인합니다.
 Estimation of Gene Abundances
https://www.edwith.org/single-cell/lecture/1417886
하지만 RPKM/FPKM은 샘플 사이에서 특정 gene의 발현이 증가/감소되었는지 경향을 확인하는데 문제가 있습니다. 이 때 TPM(transcript per million) 단위를 사용합니다.
Take Home Message
Single cell analysis 전반적인 분석 과정에 대해 알아볼 수 있었습니다.